Following the triumph of Evo Morales in Bolivia's 12 October Presidential elections we republish data circulated by Centre for Economic and Policy Research on 8 October 2014
Below are ten graphs on economic and social developments since Evo Morales' election in 2005 that help explain the strong support for his re-election.
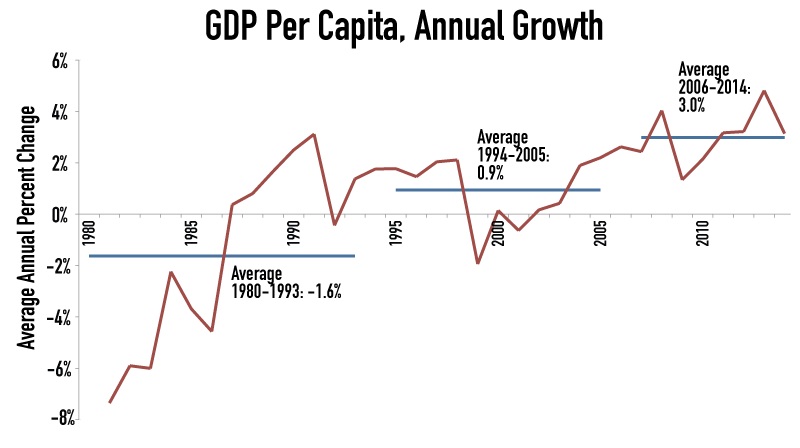
1. Economic Growth: Bolivia has grown much faster over the last 8 years under President Evo Morales than in any period over the past three-and-a-half decades.
Source: International Monetary Fund.
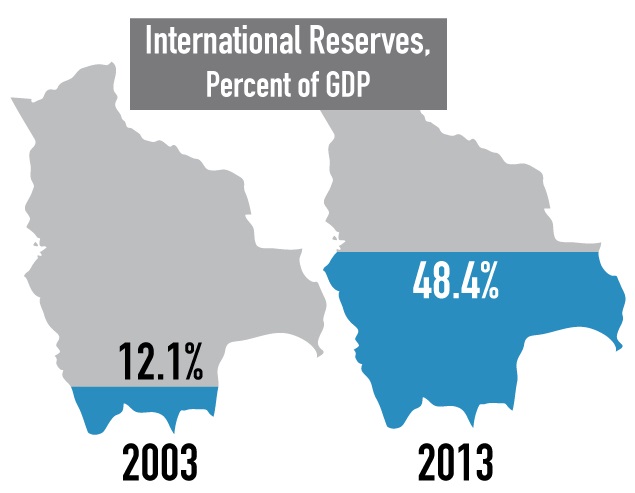
2. High Level of International Reserves: International reserves act as a buffer against external shocks, preventing balance of payments crises. Bolivia’s buildup of reserves has allowed it to avoid the often harmful conditions that come with IMF borrowing; the country operated under IMF agreements almost continuously for 20 years until Morales took office in 2006. Bolivia’s international reserves are currently more than 48 percent of GDP, higher than even China; there is room for Bolivia to put these resources to greater productive use, for example in public investment.
Source: Banco Central de Bolivia (BCB).
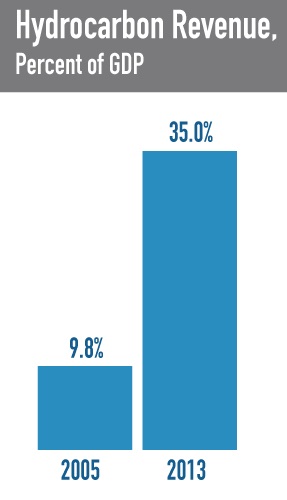
3. Nationalization Shifts Hydrocarbon Revenues to the Public Sector: A referendum vote in mid-2004 indicated public support for a greater state role in the hydrocarbons sector, and in May 2006, newly-elected president Evo Morales renationalized Bolivia’s oil and gas industries. The increased tax revenue has allowed Bolivia to vastly increase its macroeconomic policy space. Some of this revenue went into reserves, as noted above, and Bolivia also increased public investment
Source: BCB.
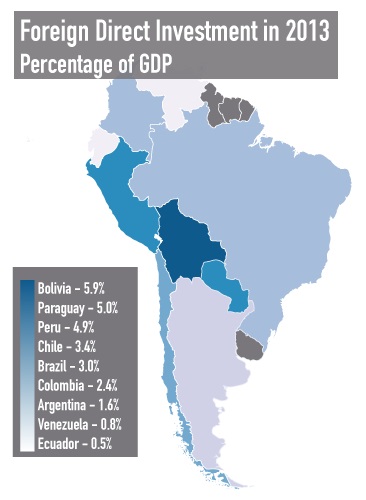
4. Highest Foreign Direct Investment in South America: While the business press consider nationalizations to be anathema to attracting international investment, Bolivia actually had the highest level of foreign direct investment, as a percent of GDP, in South America in 2013.
Source: Economic Commission for Latin America and the Caribbean
5. Public Investment is High and Increasing: Since 2006, Bolivia has made it a priority to increase public investment spending. Over the last 8 years, total public investment doubled as a percentage of GDP.
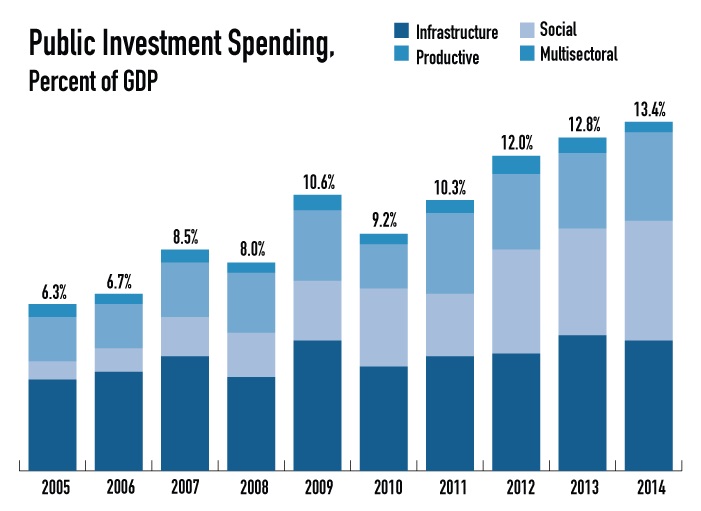
Source: Viceministerio de Inversión Pública Y Financiamiento Externo.
6. Poverty Reduced by 25 Percent, Extreme Poverty Reduced by 43 Percent: Bolivia is one of the poorest countries in South America, but poverty has been on a downward trend in recent years after stagnating at a very high level for almost a decade.
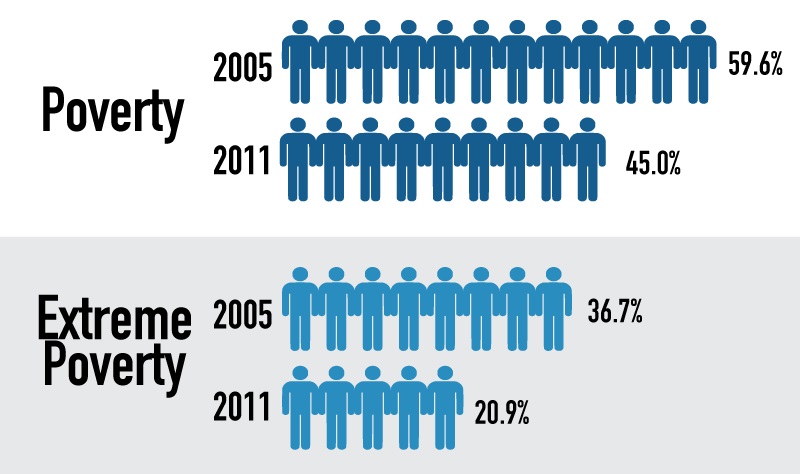
Source: Instituto de Estadística de Bolivia (INE).
7. Economic Inequality Decreases: Bolivia has been praised by Alicia Barcena, the head of the Economic Commission on Latin America and the Caribbean (ECLAC), as being “one of the few countries that has reduced inequality … the gap between rich and poor has been hugely narrowed.” As shown below (by decile), the income of the poorer sectors of the population has grown much faster since 2006 than that of the higher-income households.
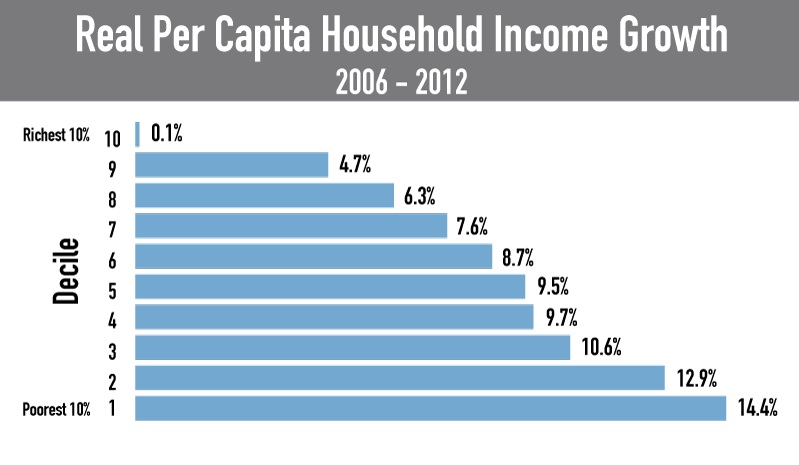
Source: Socio-Economic Database for Latin America and the Caribbean.
8. Large Increase in the Minimum Wage: One explanation for the decrease in poverty and inequality is that Bolivia has rapidly increased the real (inflation-adjusted) minimum wage. From 2005-2014, the real minimum wage increased by 87.7 percent.
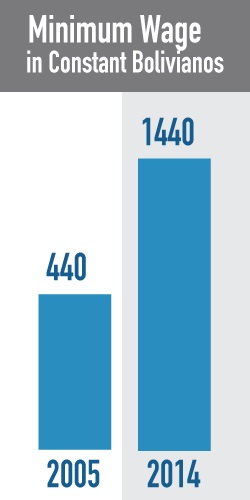
Source: INE.
9. Social Spending Increases Over 45 Percent In 7 Years: Public spending on health, education, pensions and poverty alleviation programs experienced a significant increase (of 45 percent) in real terms, but did not fully keep up with overall growth in the economy.
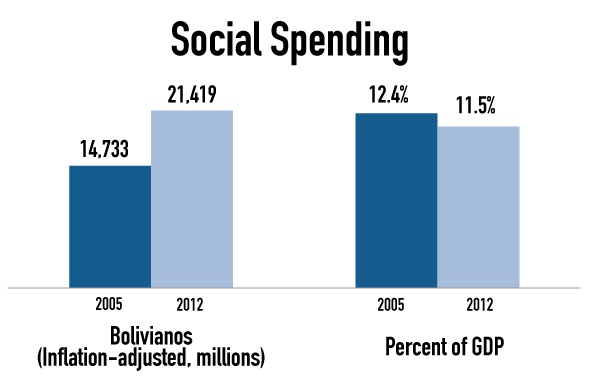
Source: Ministerio de Economía y Finanzas Públicas.
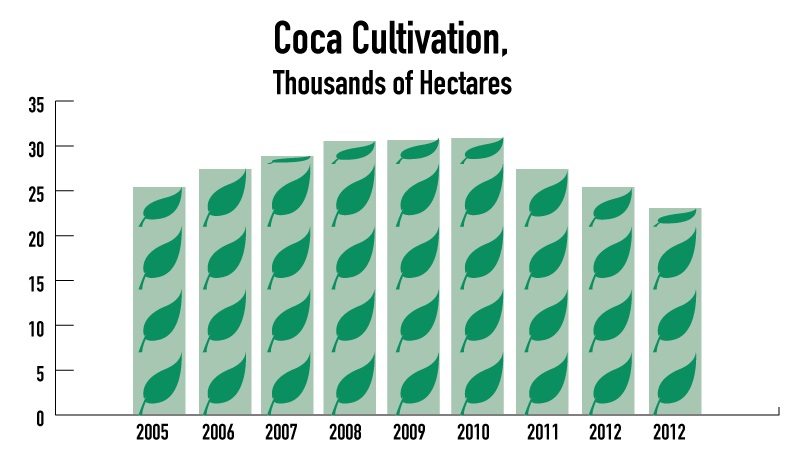
10. Pursuing Alternatives to the Drug War: In 2008, the U.S. added Bolivia to a short list of countries that had “failed demonstrably” to meet international counternarcotics agreements. Bolivia has been on the list ever since, despite having reduced the amount of coca in cultivation. Outside the U.S., President Morales has received praise for his “Coca Yes, Cocaine No” policy that emphasizes protecting human rights, and recognizes traditional, legal uses for the coca plant.
To see a spreadsheet with the underlying data, as well as links to sources, click here.

